See what's really inside the ETFs you hold or advise on.
ETFLOOK analyzes 3,200+ US- and Korea-listed ETFs by the same rules, then writes the results two ways: in-depth institutional analysis your desk can cite, and plain-language reports for individual investors.
Real output from the live platform. The figures and quoted sentences below come straight from ETFLOOK reports.
One ETF
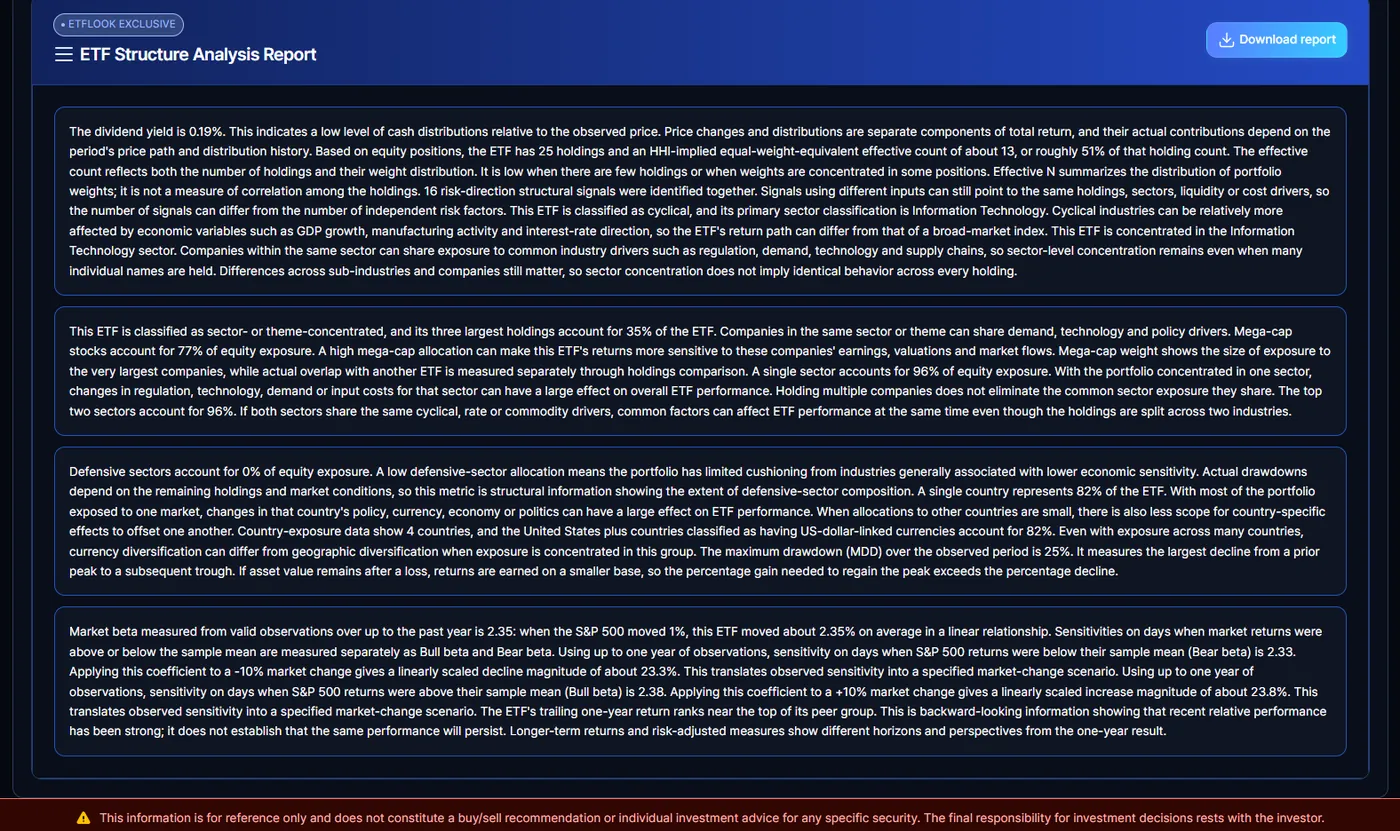
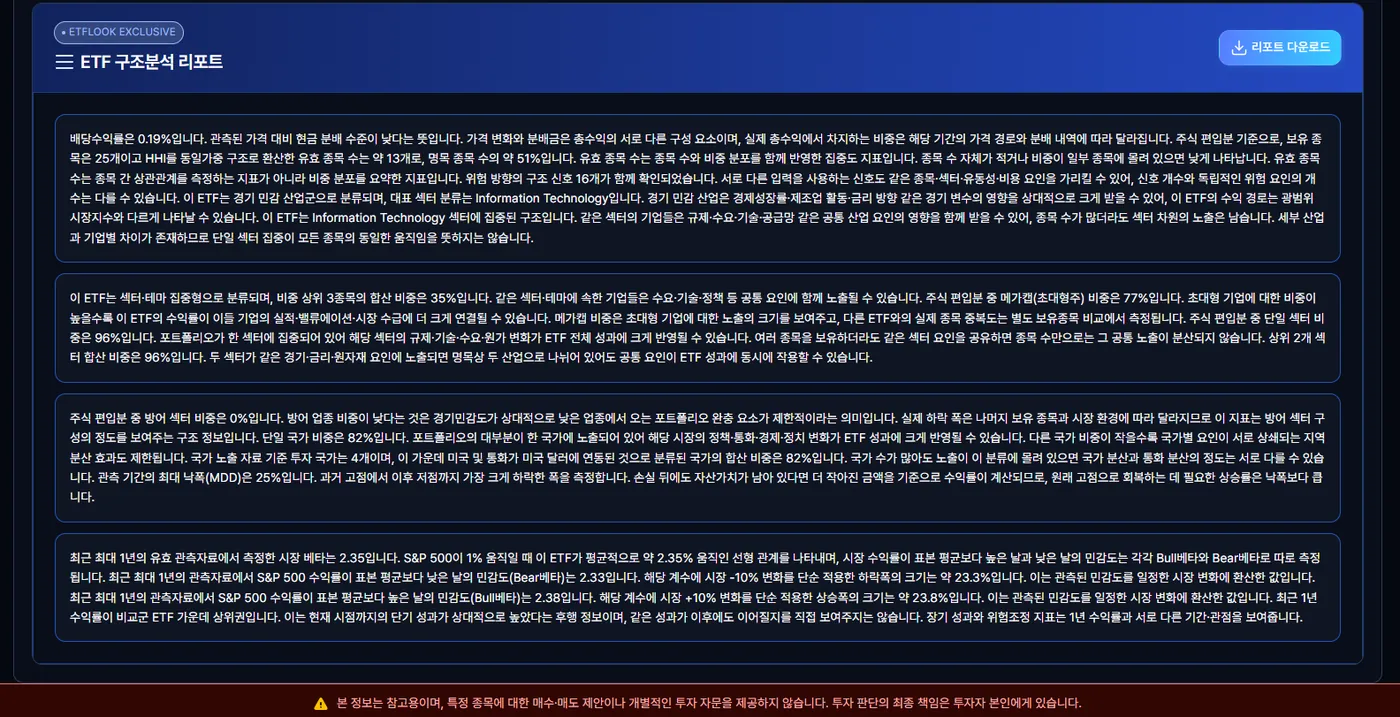
VanEck Semiconductor (SMH): 25 holdings, about 13 effective
25Holdings
~13Effective holdings
96%Single-sector weight
Based on equity positions, the ETF has 25 holdings and an HHI-implied equal-weight-equivalent effective count of about 13, or roughly 51% of that holding count. […] This ETF is classified as sector- or theme-concentrated, and its three largest holdings account for 35% of the ETF. […] A single sector accounts for 96% of equity exposure. […] Holding multiple companies does not eliminate the common sector exposure they share.
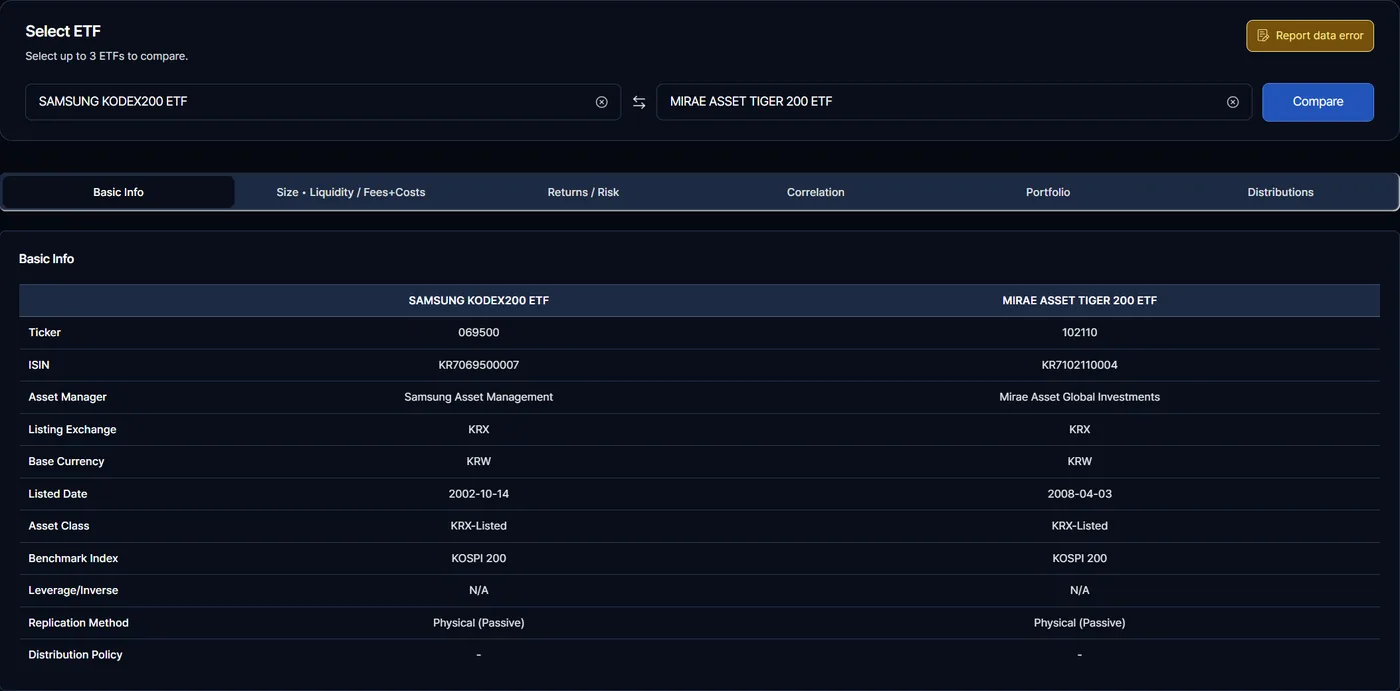
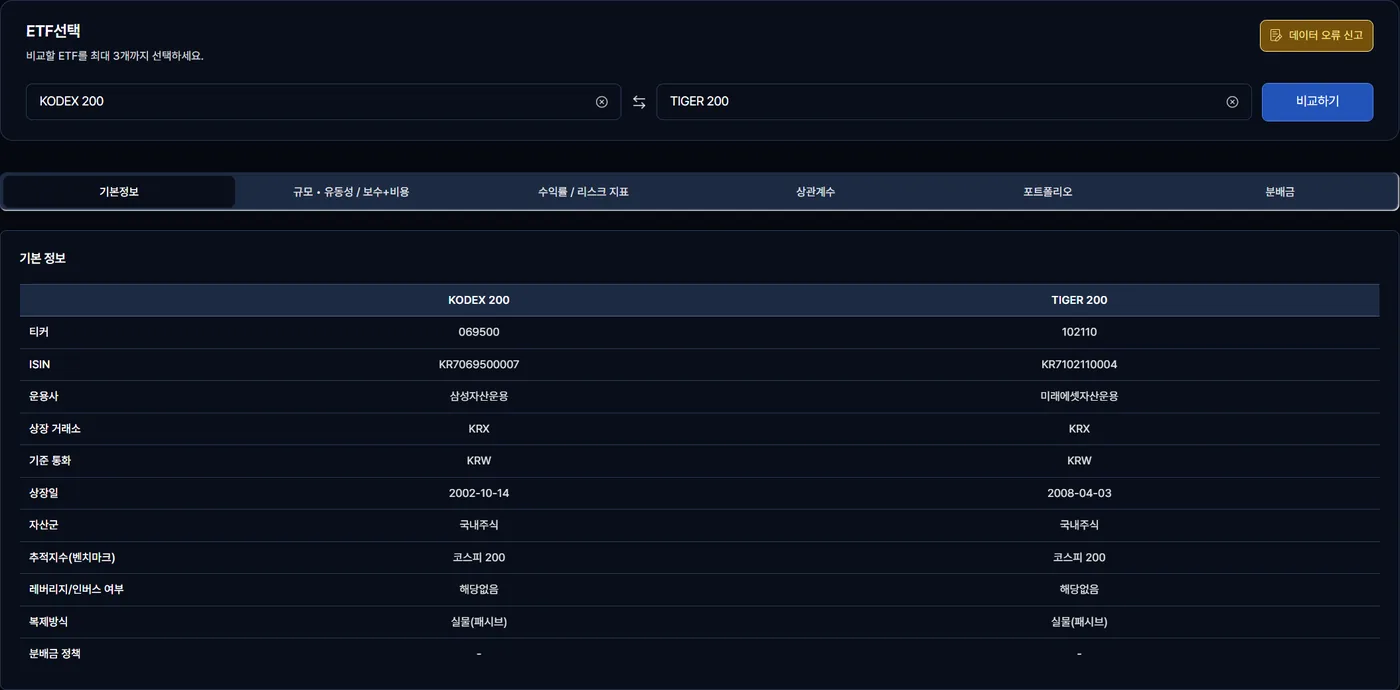
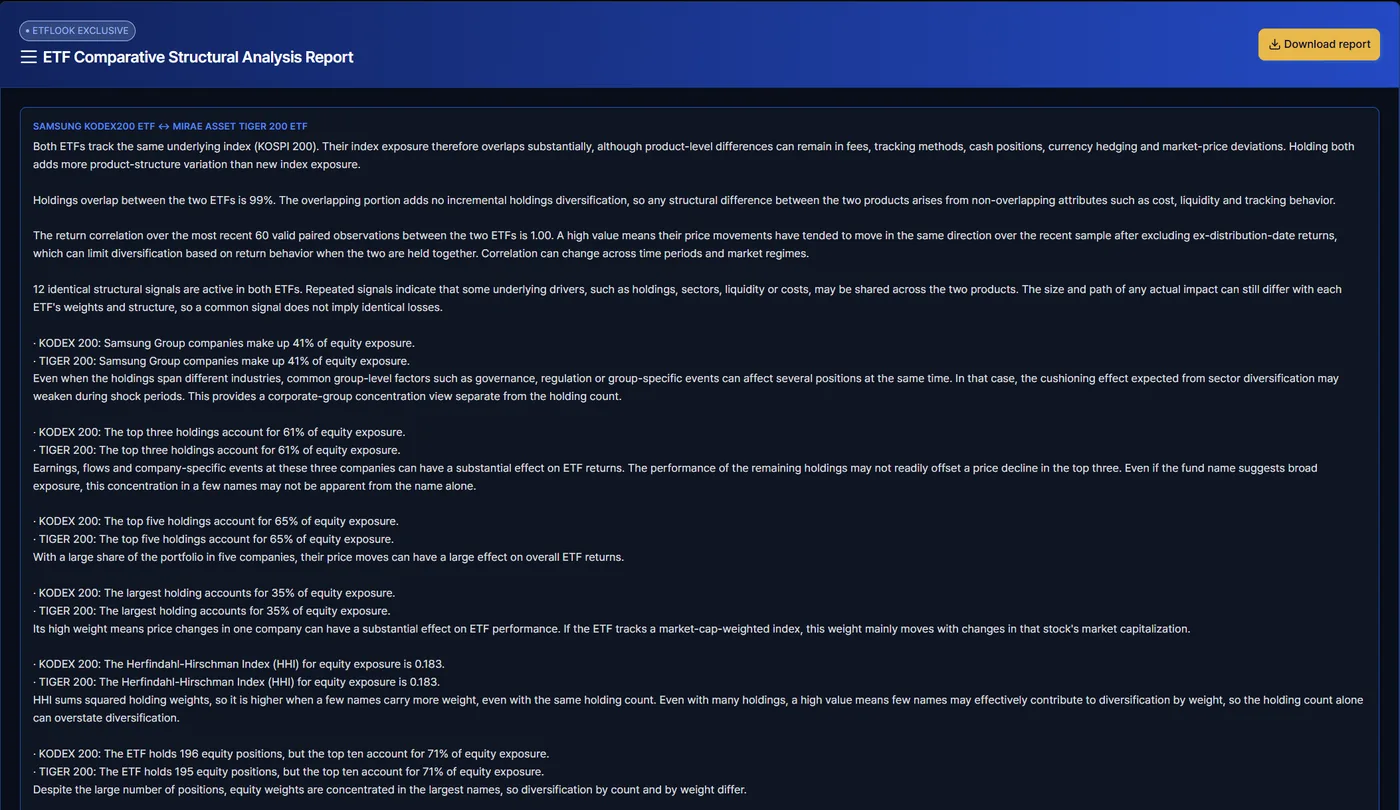
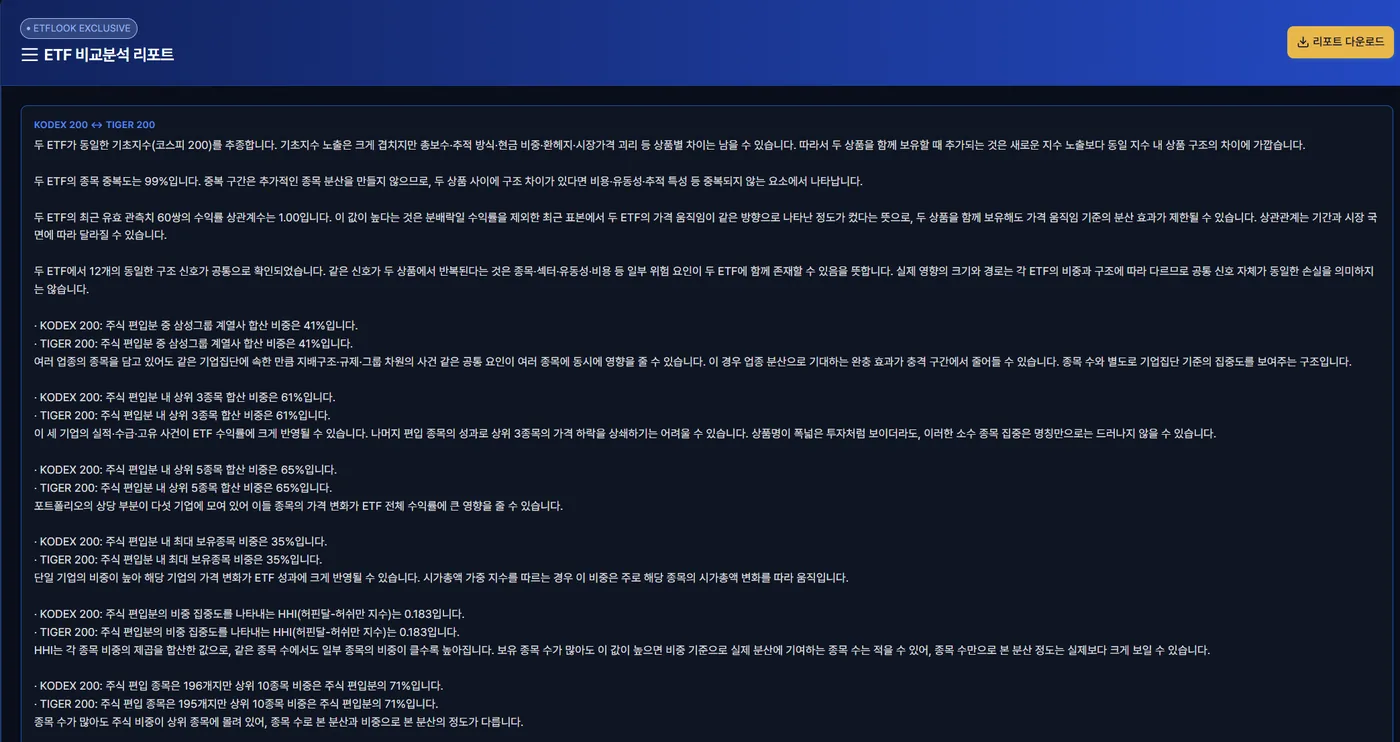
Holdings overlap between the two ETFs is 99%. The overlapping portion adds no incremental holdings diversification, so any structural difference between the two products arises from non-overlapping attributes such as cost, liquidity and tracking behavior. […] The expense-ratio gap between two ETFs tracking the same index is 0.10% per year, or about 1.0% on a simple 10-year accumulation basis. The ETF with the lower stated expense ratio is currently MIRAE ASSET TIGER 200 ETF. The 10-year figure is a simple comparison assuming the current fee gap persists; actual long-run return differences can also reflect tracking differences, market-price deviations and other factors.
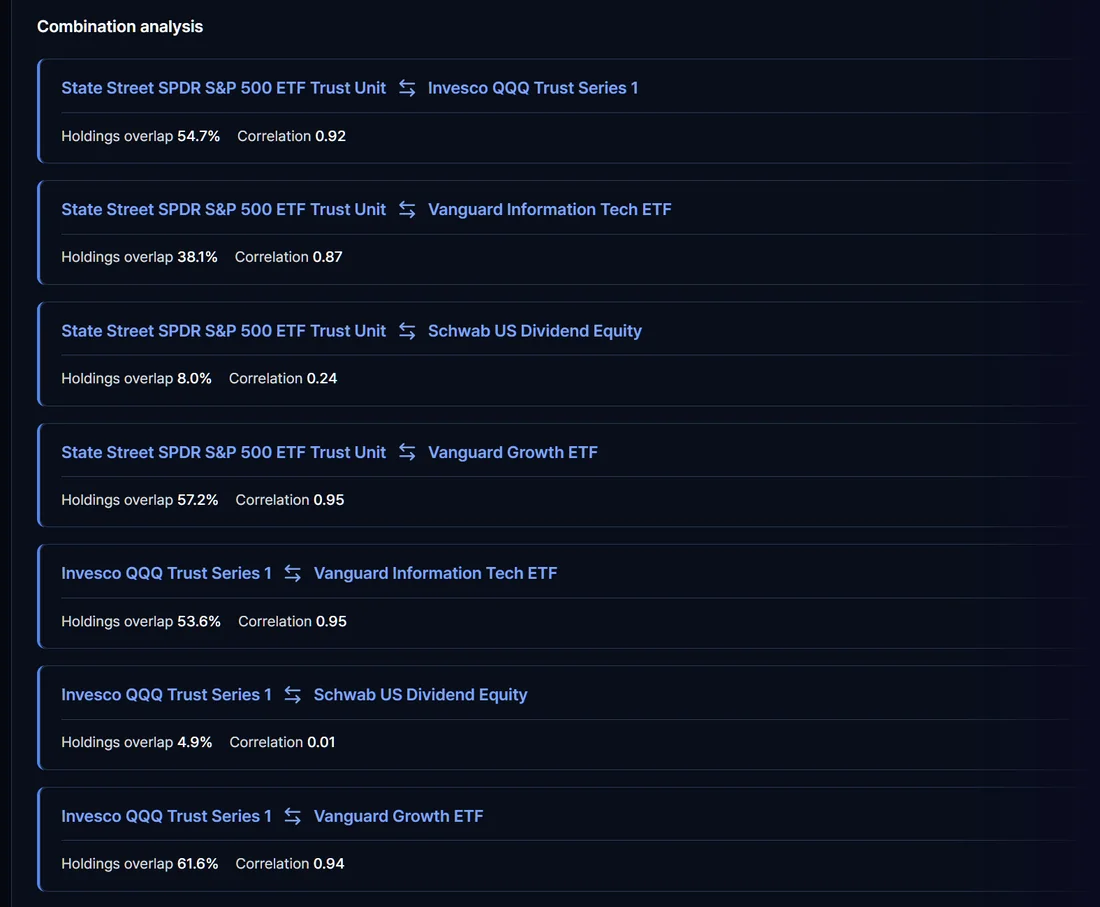
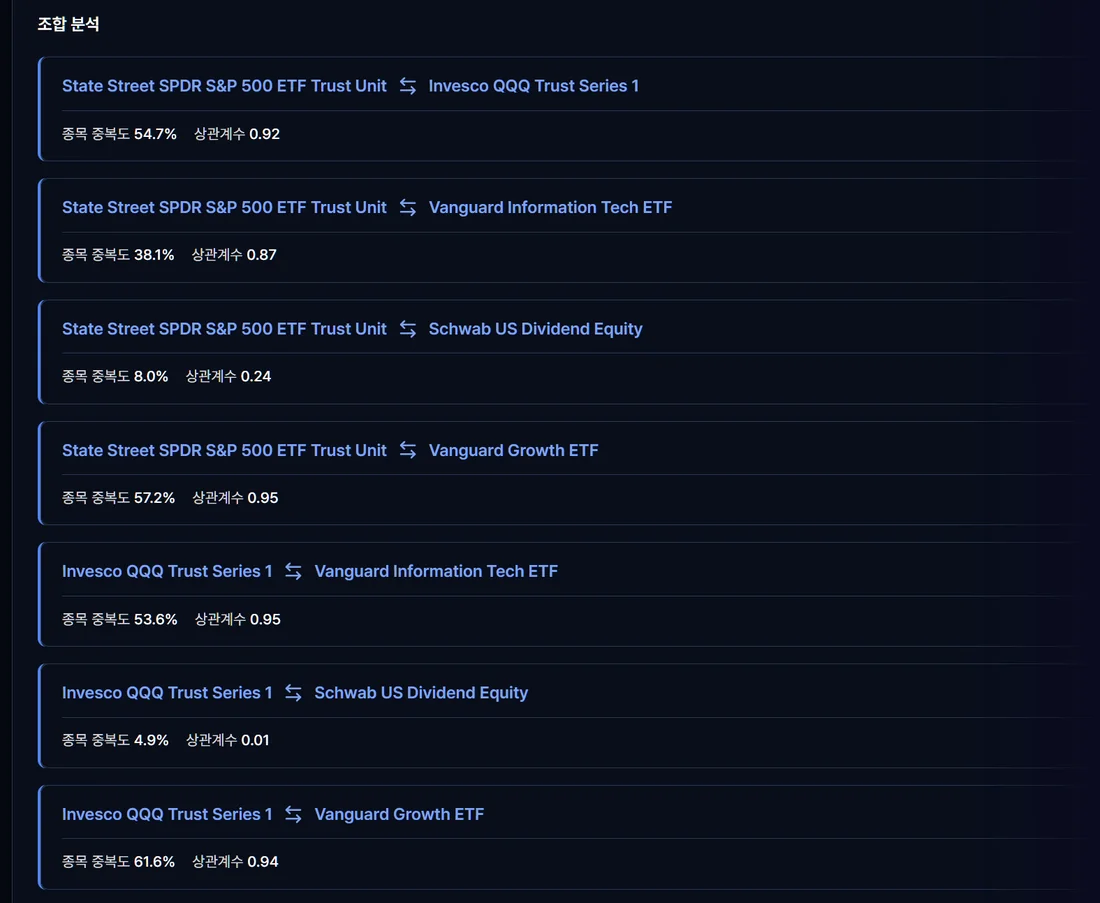
Return correlation is measured over the latest 60 valid paired observations.
An ETF data screen usually stops at the figures. ETFLOOK reads each one in the context of the product's structure and writes down what it means, in Korean and English.
TQQQProShares UltraPro QQQ
Six findings from one ETFLOOK report on TQQQ, side by side. Both versions come from the same data and the same rules. The institutional version adds where the fund ranks among the 28 leveraged ETFs with the same 3x multiple, the sample behind each figure, a dollar amount and the next review points.
For individual investorsFor institutions
Expense ratio0.97%
For individual investors
The stated expense ratio is 0.97% per year, and simply adding the same rate over ten years gives a nominal total of about 9.7 percentage points. This is a simple cumulative reference for the stated fee, not an estimate of realized performance after asset-value changes, compounding, tracking differences or other costs. Actual performance gaps between ETFs can also reflect replication and tracking characteristics.
For institutions
The disclosed expense ratio (before waivers and reimbursements) is 0.97% per year. On a USD 1,000,000 position the annual fee is about USD 9,700. Among leveraged ETFs (28 funds), it ranks joint 15th–16th from the largest by expense ratio. This is the disclosed fee rate and excludes trading costs and tracking difference. Next review points: the net expense ratio after waivers and reimbursements and the waiver expiry date in the issuer’s disclosure.
Maximum drawdown37.2%
For individual investors
The maximum drawdown (MDD) over the observed period is 37%. It measures the largest decline from a prior peak to a subsequent trough. If asset value remains after a loss, returns are earned on a smaller base, so the percentage gain needed to regain the peak exceeds the percentage decline. For example, after a 50% decline, a 100% gain is needed to return to the original peak.
For institutions
The maximum drawdown over the past year on a price basis is 37.2%, and the price at the reference date is 19.0% below the window high. The gain required from that trough to the preceding peak is 59.2%. Among leveraged ETFs (28 funds), it ranks 18th from the largest by maximum drawdown. This is an observed value from the past price path and does not set a limit on future losses. Next review points: the dates of the peak and the subsequent trough that produced the maximum drawdown, and the reference-date close.
Annual volatility drag17.1%
For individual investors
Based on annualized volatility of 22-28% for the underlying asset (NASDAQ-100 Index), this ETF's theoretical annual volatility drag is about 17.1%. This approximates the structural loss that can remain in this ETF over a year in which the underlying finishes back at its starting level.
For institutions
Using the underlying (NASDAQ-100 Index) annualized volatility of 22-28%, the ETF’s theoretical annual volatility drag is about 17.1%. Among leveraged ETFs (28 funds), it ranks joint 8th–11th from the largest by annual volatility drag. A structural estimate under a constant-volatility assumption; realized path outcomes differ. Next review points: the observation window of the annualized volatility and the as-of date of the underlying price source.
Show 3 more findings
Bear beta4.24
For individual investors
Using up to one year of observations, sensitivity on days when S&P 500 returns were below their sample mean (Bear beta) is 4.24. It is the average response per 1-percentage-point move in the market’s daily return on weaker-than-average days, not a cumulative multi-day loss or the expected loss from a specific decline.
For institutions
Over up to one year, sensitivity on days when S&P 500 returns were below the sample mean (125 days, Bear beta) is 4.24, a difference of -0.05 from the overall beta. Among leveraged ETFs (28 funds), it ranks 6th from the largest by Bear beta. Because the split is at the sample mean, days below the mean can include small up days; as a daily-return sensitivity, it does not represent a multi-day cumulative loss. Next review points: the start date of the down-day window and the largest single-day S&P 500 decline within it.
Beta4.28
For individual investors
Market beta measured from valid observations over up to the past year is 4.28: when the S&P 500 moved 1%, this ETF moved about 4.28% on average in a linear relationship. Sensitivities on days when market returns were above or below the sample mean are measured separately as Bull beta and Bear beta.
For institutions
Market beta relative to the S&P 500, measured from 248 daily return pairs over up to the past year, is 4.28. Among leveraged ETFs (28 funds), it ranks 6th from the largest by beta. This is a sensitivity in daily returns and does not represent a multiple of cumulative returns over several days. Next review points: the start and end dates of the beta observation window.
Volatility ratio to index3.0x
For individual investors
Over the observation period, ETF volatility is 3.0x that of the tracked index. A value above 1 means the ETF's return variability was greater than the index's over the same measurement window. The ratio describes relative historical volatility and does not forecast the size of future gains or losses.
For institutions
Over the observation window of up to one year, ETF volatility is 3.0 times that of the tracked index. Annualized from daily returns over the same window, volatility is 58.7% for the ETF and 19.7% for the tracked index. Among leveraged ETFs (28 funds), it ranks 22nd from the largest by volatility ratio to index. The ratio to index volatility is specific to the observation window and changes with the window. Next review points: the observation start date and the source of daily ETF and index returns for the same window.
TQQQ · ETFLOOK report text as of Oct 19, 2026. Both versions use the same data; highlighted phrases are what the institutional version adds. White-label PDFs issued to clients use the individual-investor wording.
Product Tour
Structure, comparison, portfolio and market, in one place.
What is this ETF really concentrated in?A structure report on each ETF pageAn equity ETF page has 7 tabs, from prices and returns to holdings, distributions and fund flows. Below them, a rule-based report explains concentration, sectors, countries and market sensitivity in plain language.
Click or tap to enlarge
Do two tickers add different holdings, or repeat the same exposure?Compare up to 3 ETFsFor equity ETFs, line them up across 6 tabs. The report then explains what actually differs: holdings overlap, cost gap, correlation, tracking and liquidity.
Click or tap to enlarge
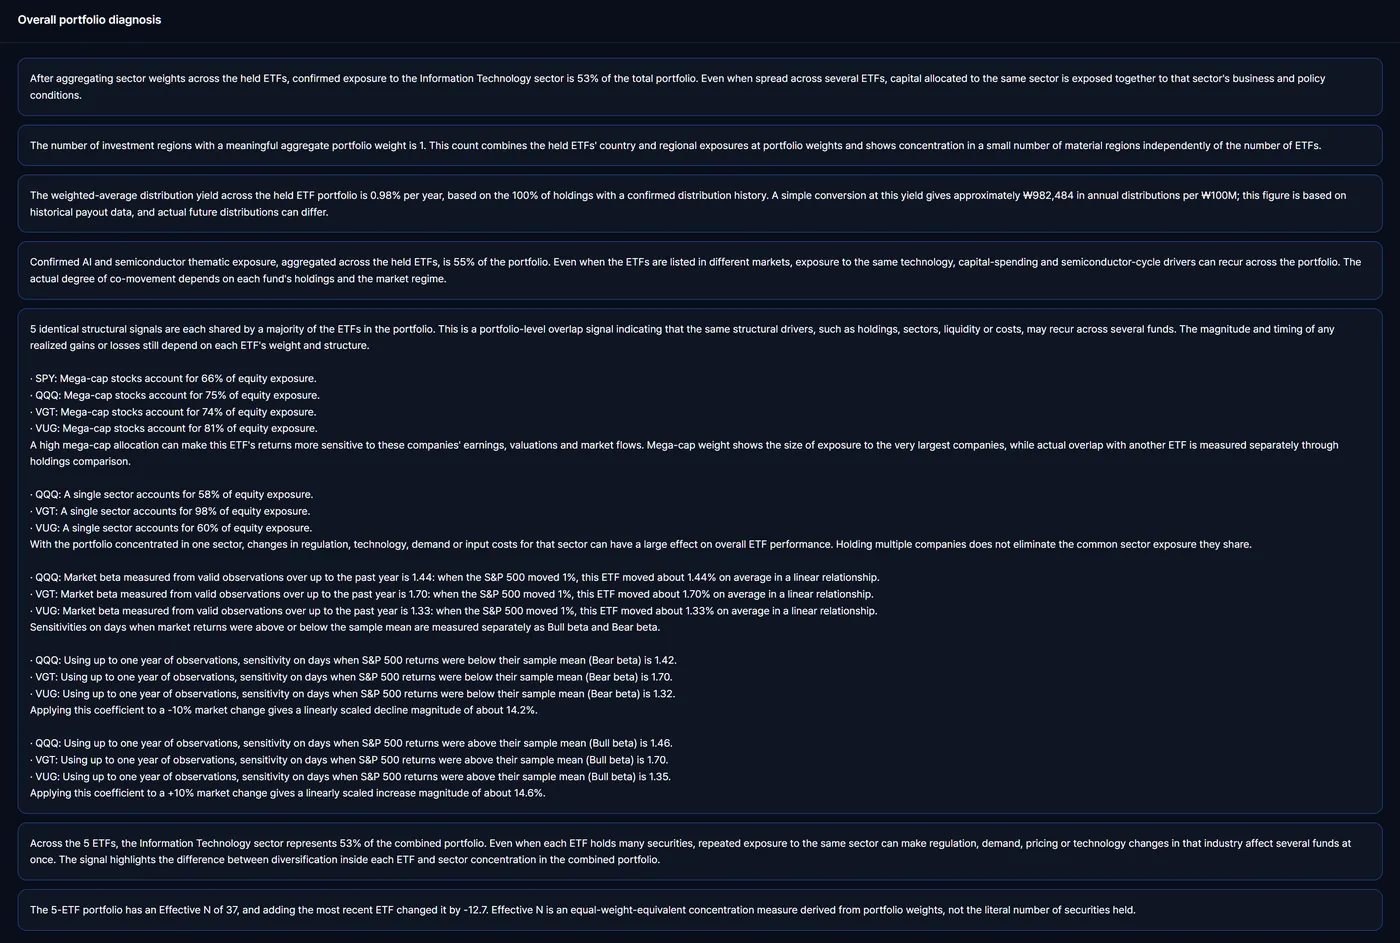
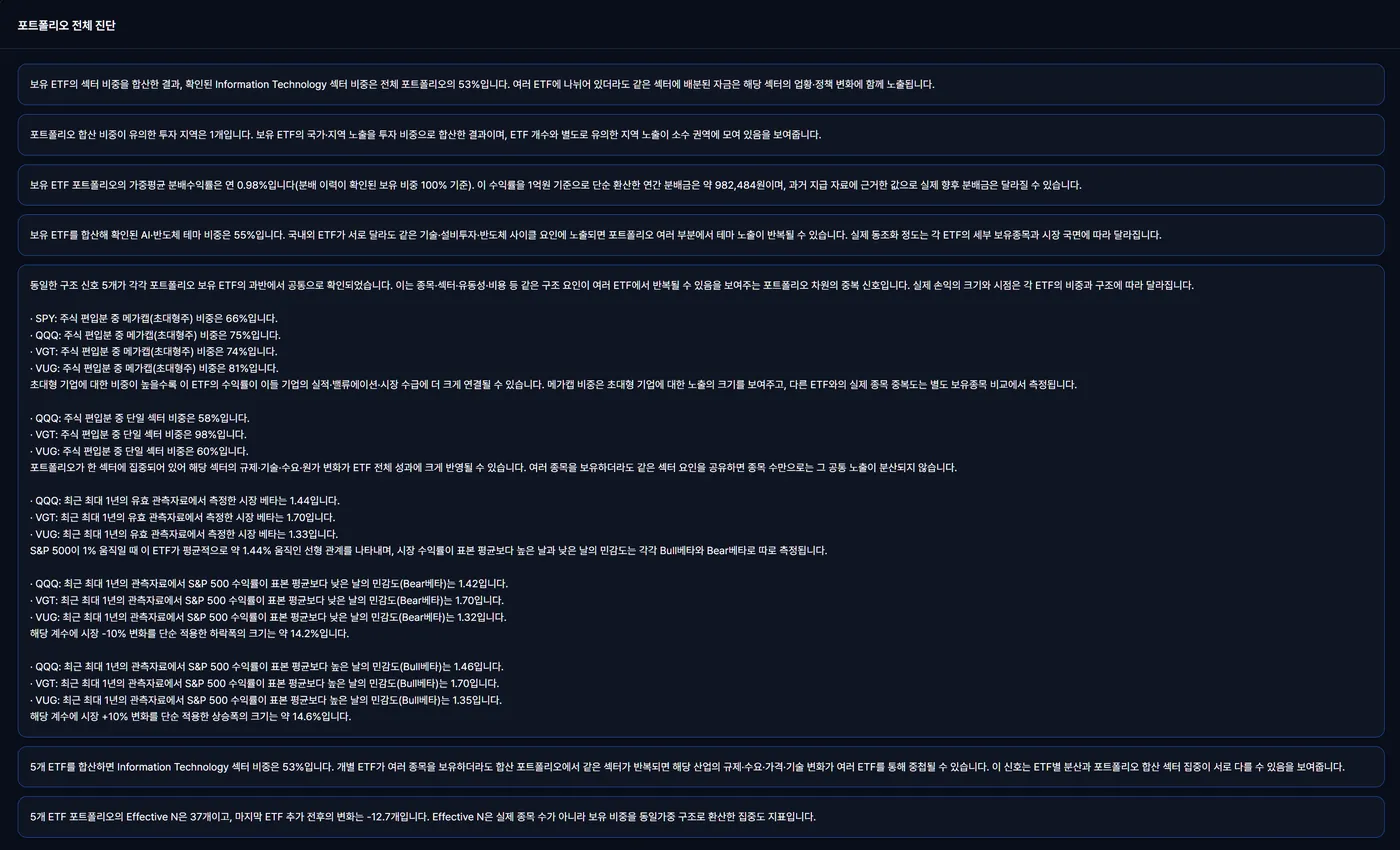
What does the mix hold as a whole?Analyze up to 5 ETFs with your own weightsEffective N, cross-holdings overlap and worst-case stress loss under historical scenarios, followed by an overall portfolio diagnosis. Swap in a virtual ETF to test a change.
Click or tap to enlarge
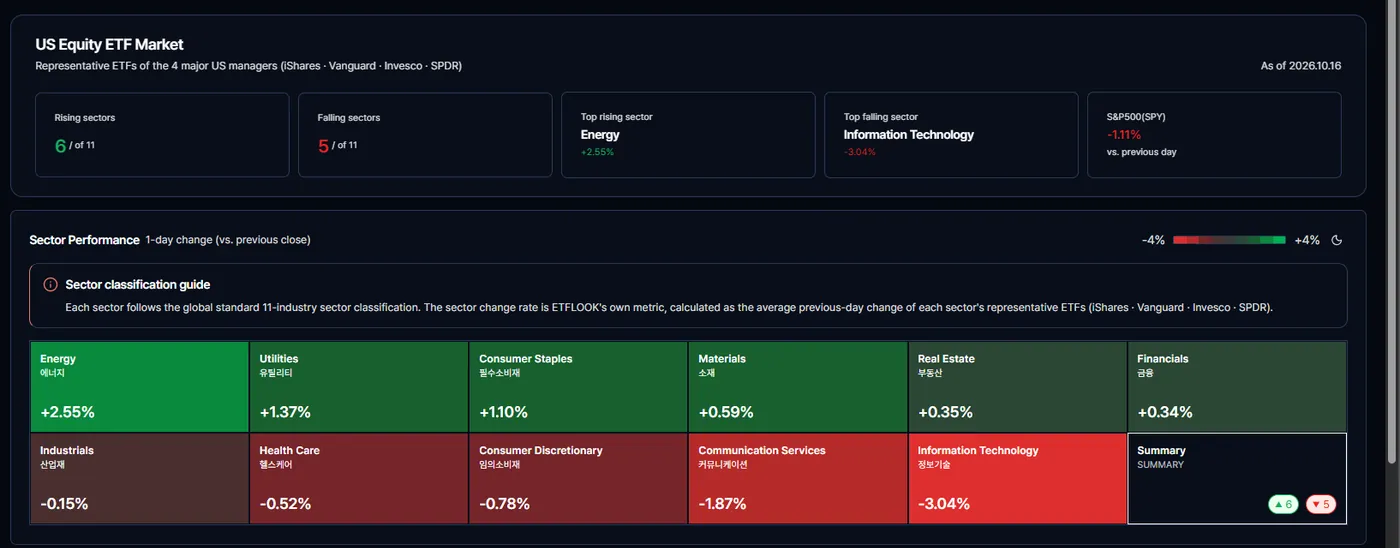
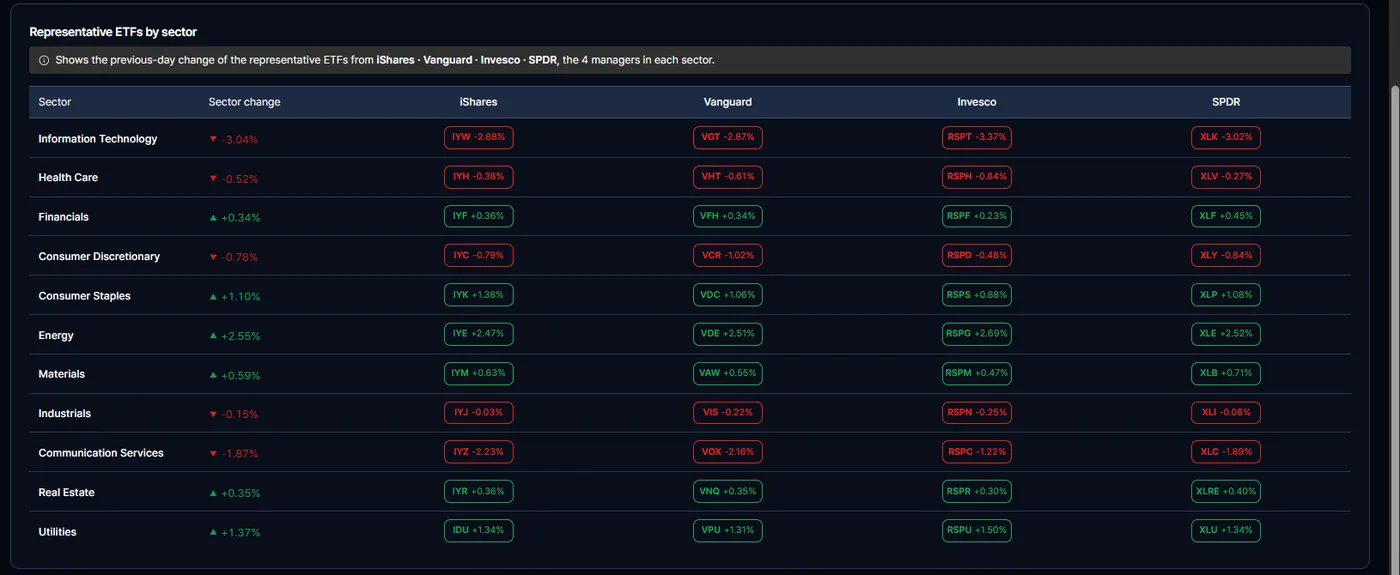
Which sectors are moving, and through which ETFs?US equity market by sectorSector moves measured through representative ETFs from 4 major US managers (iShares · Vanguard · Invesco · SPDR), with each manager's ETF side by side.
Click or tap to enlarge
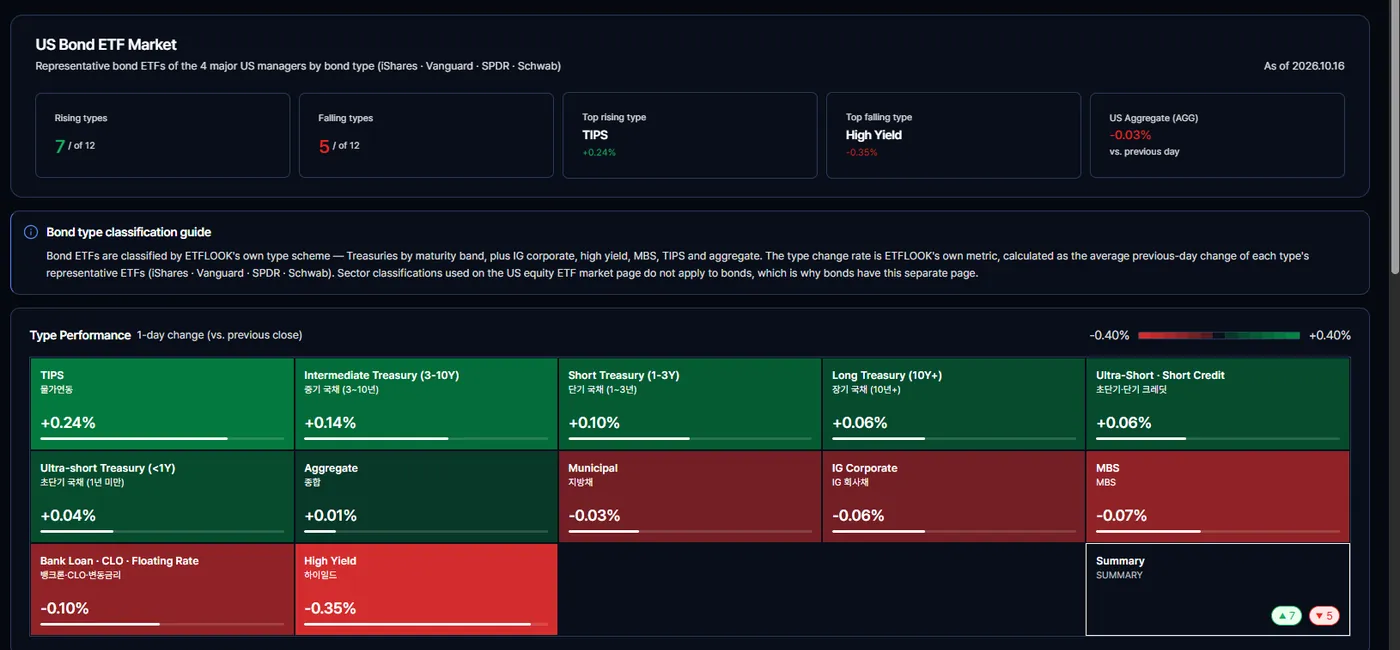
How are bond types moving, from Treasuries to credit?US bond market by type12 bond types, from Treasuries by maturity to credit, MBS, TIPS, municipal and aggregate, with representative ETFs from 4 major US managers (iShares · Vanguard · SPDR · Schwab) side by side.
Screens from the live platform, captured Oct 16–21, 2026. Figures are as of each capture date.
The Problem
Diversification Illusion in ETF Portfolios
Investors increasingly hold multiple ETFs — yet few can clearly explain how these products interact structurally. Overlapping exposures, hidden factor concentrations and opaque cost layers often go unnoticed until markets turn.
Overlap tools exist. What still takes manual work is turning the numbers into an explanation a client can follow and a record the desk can keep. ETFLOOK automates that step for financial institutions and advisors and, outside Korea, for individual investors.
How It Works
From raw ETF data to client-ready insight, automatically.
01
Structural Analysis Engine
900+ structural assessment rules for equity, bond and mixed ETFs evaluate concentration, sector tilt, factor exposure, cost layers, duration, credit and tracking quality. The analysis and report engines run on patent-pending methods.
02
Plain-Language Reports
Findings become standardized narratives in Korean and English. Every sentence traces back to a rule — the same data under the same rule version always produces the same report.
03
Intuitive Analysis Environment
Search, compare and analyze portfolios in one place. Institutions can issue white-label PDF reports under their own brand.
◈
Diversification Illusion Detection
Find hidden overlaps between the ETFs in a portfolio and see the true concentration a simple holdings list misses.
◉
Rule-Based Structural Assessment
900+ rules classify each ETF's structure and flag structural risks automatically — no generative guesswork in the judgment.
⬡
US + Korea, Equity · Bond · Mixed
One structural framework across US-listed and Korea-listed ETFs, from equity to bond and mixed products.
Who It's For
Two ways to use ETFLOOK.
Institutions & Advisors
Consistent ETF analysis across your team.
Private bank WM desks · independent RIAs and family offices · securities firms
An institutional version, in more depthInstitutional reports state key figures with their denominator, scope, period and data date, say what a figure does not include, and end with next review points.
Same standard, every timeThe same rules run on the same data, so the analysis itself does not change with who runs it or how busy the desk is.
A dated record for your reviewEvery analysis states its data date, so you can record which structure you reviewed at that point and cite it later.
One analysis, two outputsInstitutional wording for your desk's review, and a plain-language white-label PDF under your brand for the client. Team accounts keep the whole desk on the same reports.
One structural review, from client meeting to file.
How a private bank WM desk can review a client's ETF portfolio with ETFLOOK.
01
Before the meeting
Enter the client's ETFs and weights, up to 5 at a time. ETFLOOK analyzes them together as one portfolio, not one fund at a time.
02
During the review
Read the overall portfolio diagnosis in plain sentences: where the ETFs overlap, which sector or market dominates, and how the mix has moved with the market. Test a change with a virtual ETF swap before discussing it.
03
After the review
Keep the institutional report on file for the investment committee, and issue a plain-language white-label PDF to the client.
For individual investors outside Korea: check how much a new ETF overlaps with the ones you already hold before you add it.
FAQ
Common questions.
Is ETFLOOK investment advice?
No. ETFLOOK explains ETF structure for informational purposes. It does not recommend buying or selling any security, and investment decisions remain yours.
How do institutional and individual reports differ?
Both run on the same data and the same rules; they differ in style and depth. Institutional wording states key figures with their denominator, period and data date, says what a figure does not include, and adds next review points for professional review and internal records. White-label PDFs issued to clients use the plain-language wording.
Can I see a sample before a meeting?
Yes. The screens and report text on this page come from the live platform. Tell us an ETF, a pair to compare or a portfolio, and we will send a full sample report before we meet.
Effective N is an equal-weight-equivalent concentration measure derived from portfolio weights, not the literal number of securities held, and it does not reflect correlation among holdings. Holdings overlap measures the share of positions two ETFs hold in common, while return correlation measures how closely their prices moved together, so the two can differ. Worst-case stress loss is the estimated maximum loss under major historical stress scenarios. Like beta and maximum drawdown, it comes from past data and does not indicate a limit on future losses.
Can individual investors use ETFLOOK?
Yes, outside Korea. Individual investors can start free on the platform. In Korea, ETFLOOK serves financial institutions.